The Effect of Sunspot Size and Latitude On
Magnetic Field Strength in Sunspots
Mullins, Sarah E. and Stanley, Sheena
Dr. Steve Rapp A. Linwood Holton
Governor’s School
Abstract-We conducted research to determine the magnetic field
strength via Zeeman line splitting in infrared (IR) spectra for targeted
sunspots of different sizes and latitudes. The unique infrared capability and
large aperture of the McMath-Pierce telescope made it perfect for this type of
study. We collected several data sets over a two-day period. Using computer
programs KP and Image J, we reduced the data and determined the magnetic field
strength of active regions on the Sun at that time. A total of three active
sunspot regions were observed and reduced for further research. After reducing
and analyzing the data we collected, we can say that size and latitude are factors in the magnetic field strength of
sunspots. The greater the area of a sunspot, the greater the magnetic field
strength is. The closer the sunspot is to the poles of the Sun, the greater the
magnetic field strength is.
Introduction-We were 1,941 miles from home and
6,875 feet above sea level before we realized it was not just a dream. After
researching for hours, writing a proposal, and conducting a few
teleconferences, we were really at the Kitt Peak National Observatory. We were
two students standing on a mountain made for research. A once in a lifetime
opportunity stood before us, and we took full advantage of it. Our purpose was
to research sunspots on the world’s largest solar telescope (see Image 1) in
hopes of learning more about the world of science.
We conducted research to determine the magnetic
field strength via Zeeman Line Splitting in IR spectra for targeted sunspots of
different sizes, latitudes, and intensities.
The unique infrared capability and large aperture of the McMath-Pierce
telescope made it perfect for this type of study. We collected several data
sets over a two day period, December 2, 2004 through December 3, 2004. Using
the “Data Reduction” and analysis (“KP”) programs, we reduced the data and
determined the magnetic field strength of active regions on the Sun at that
time. With the Image J program, we determined the latitude and longitude range
and the area for each sunspot. A total of three active sunspot regions were
observed and reduced for further research.
Sunspots have been compared to low-pressure areas, tornados, or huge whirl winds in the solar gas. Complex movements of gas both into and away from a sunspot have been observed. Recent theories say that sunspots are cool areas produced by reactions between the charged gases of the Sun and solar magnetic fields. A local magnetic field breaks through the surface of the photosphere and produces a spot that place. They are cooler and less bright than the rest of the photosphere. The umbra, a dark central region of the sunspot, is 5 times less bright than the surrounding photosphere and so appears dark. The penumbra is the lighter surrounding area. At certain places near the edge of the Sun, the spots look like depressions in the photosphere. The intensity of the magnetic field strength would increase as you approach the umbra and decrease as it leaves the umbra (http://www.exploratorium.edu/sunspots/index.html).
The Zeeman Effect, or Zeeman splitting, is the splitting of spectral lines. It was named after Pieter Zeeman, a Dutch physicist. Zeeman Splitting can be used to study the magnetic field strengths of stars and sunspots. The Zeeman Effect can show variances in magnetic field strength, from weak fields with very little spectral line splitting to strong fields with a lot of spectral line splitting. (http://www.daviddarling.info/encyclopedia/Z/Zeemaneffect.html).
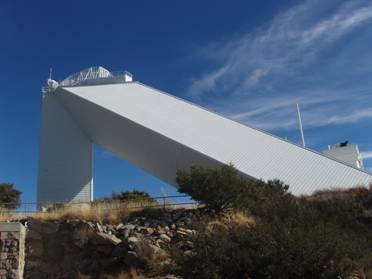
Image 1- McMath-Pierce Solar Telescope (photo by Sarah Mullins)
Our scientific
motivation was multifaceted. First, we set out to prove our hypothesis, true or
false. We set out to prove that the magnetic
field strength of a sunspot becomes greater as the area of a sunspot increases;
we also wanted to determine if the magnetic field strength of a sunspot was
greater if it was closer to the poles of the sun. Second, we wanted to gain
more experience with scientific research. Finally, our third objective was
possibly to discover something unknown about sunspots. We felt that it was
important to use our knowledge to learn more about the unknown and use all
possible resources in doing so.
Observations and data reduction - To retrieve the information to conduct the research, we were privileged enough to use the world’s largest solar telescope, the McMath-Pierce telescope. Infrared spectroscopy and imaging is one of its primary uses. On November 29 - 30, 2004, we used the 13.7-m Czerny-Turner solar spectrograph, which scans wavelengths, and utilizes an infrared camera called the Near Infrared Magnetograph (NIM). The infrared camera incorporating a 256 x 256 indium antimonide array detector can be used with the visible grating in the range 1 - 2.5 microns and for direct imaging over the range 1 - 5 microns. With this instrument we captured images of sunspots and took spectra of them at about 1.5 microns.
Using the NIM and
its adaptive optics, we followed a process to retrieve the information. We
locked on to active regions of the Sun and scanned across them (see Image 2).
After the scan of each active region, we also had to obtain “darks” and “flats”
scans. Darks and flats are used to subtract the instrumental "noise"
and normalize the data (respectively). To do this, the data reduction program
basically subtracts the darks from the data and divides the data by the flats.
To obtain the dark scan, we closed the shutter. Next we had to take the flats.
Simultaneously we stepped across the featureless part of the photosphere while
scanning across the spectrum. This was in an effort to normalize both spatially
and spectrally. After we had the scans, we were ready to start reducing and
analyzing the data.
To reduce the data, we used the “Data Reduction” program on the Solar
Data CD-ROM. We chose an image frame from the middle of the region, about 50.
Then we chose a dark frame and a flat frame. Then we saved the results so we
could view them later. We did the above process for each scan of each active
region.
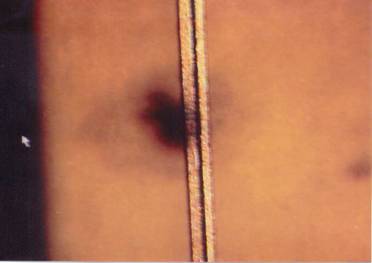
Image 2-
Scanning Across the Sun (photo by Sarah Mullins)
Using the data analysis program
called “KP”, we then opened a spectra image (see Image 3) from the middle of
the active region. We drew a small box around the central region of the umbra
of one set of split spectral lines. Then we found the left, center, and right
pixel location of the Zeeman lines. Then we calculated the differences between
the center and left-hand point and between the right-hand point and the center.
We converted the differences in pixel to differences in Angstroms by
multiplying the pixel difference by 0.0825 Angstroms/pixel.
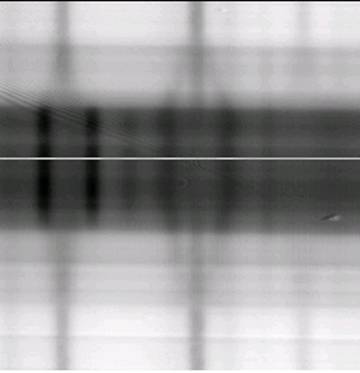
Image 3-
Spectra Image of Zeeman Splitting (photo taken by Dr. Steve Rapp)
Using our Angstrom
differences, we used the formula below to find the magnetic field strength in
Gauss (see Table 1).
B = 2.13 x 10¹²
[∆λ/( λ2·g)]
We found the
standard deviation for each scan of the active regions by taking the magnetic
field strength from the right to the center minus the magnetic field strength
from the center to the left. Using the standard deviation formula:
SD=sqrt {Σ (x-mean)2(1/n-1)}
we found that
possibility for error could be + or – 239.075 Gauss. To find the standard
deviation, we added a pixel to the pixel difference from the central spectral
line minus the left spectral line and used that value in the magnetic field
strength equation. We then subtracted a pixel from the pixel difference from
the central spectral line minus the left spectral line and used that value in
the magnetic field strength equation. We took the larger of the two values that
we found and subtracted the lesser value. We divided the difference between the
two new magnetic field strength values by 2 to determine that the possible
error for our magnetic field strength calculations is + or – 239.075.
|
Magnetic Field Strength of Sunspots (Calculated in Gauss) Error + or – 239.075 Gauss |
||
|
|
Center Spectral Line - Left Spectral Line |
Right Spectral Line - Center Spectral Line |
|
Active Region 0706 |
2151.66 |
2390.74 |
|
Active Region 0707 Part A |
2868.89 |
2868.89 |
|
Active Region 0707 Part B |
2390.74 |
2390.74 |
|
Active Region 0707 Part C |
1673.52 |
1912.59 |
|
Active Region 0707 Part D |
2151.66 |
1912.59 |
|
Active Region 0708 |
2390.74 |
2390.74 |
Table 1- The Magnetic Field Strength of Active Regions 0706, 0707, and 0708
To make the spectroheliograms, we
opened a reduced data file. We drew a box around the entire spectrum. Then the
program processed the data and saved it. We were then able to view an image of
our sunspots.
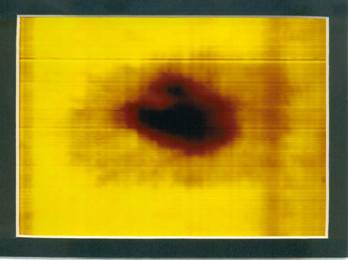
Image 4- A
Spectroheliogram that we made of active sunspot region 0707A using the KP
program
We used Image J
to find the area of the active regions. To do this, we first retrieved a fits
file from the Big Bear Solar Observatory (http://www.bbso.njit.edu/).We opened the file in Image J. Then we
maximized the area by focusing on one active region and zooming in on it. We
drew a box around the active region and adjusted to the threshold. We counted
the pixel number across the Sun and found it to be 784. We know the diameter of
the Sun is 1.4 million Km. We set the scale by using the above measurements.
After finding the pixel distance across each sunspot, we converted that
distance to kilometers. Using the kilometer measurements the sunspots, we
calculated the area of each sunspot. With scan 0707, we found the area of each
of the three smaller spots, the larger spot, and then added them together.
After we calculated the area in kilometers, we converted our area measurements
in astronomical units (see Table 2).
|
Sunspot Area In millions of km2 |
|
|
Active Region 0706 |
331 |
|
Active Region 0707A |
331 |
|
Active Region 0707B |
31 |
|
Active Region 0707C |
51 |
|
Active Region 0707D |
76 |
|
Active Region 0708 |
527 |
Table 2- The Sunspot
Areas of Active Regions 0706, 0707, and 0708
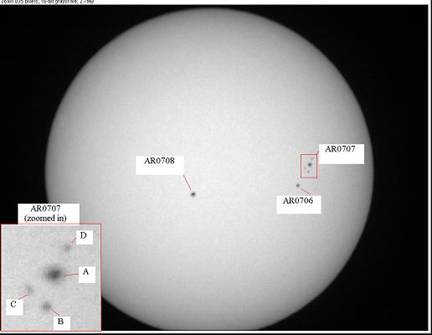
Image 5- jpg image from BBSO with labeled active sunspot regions
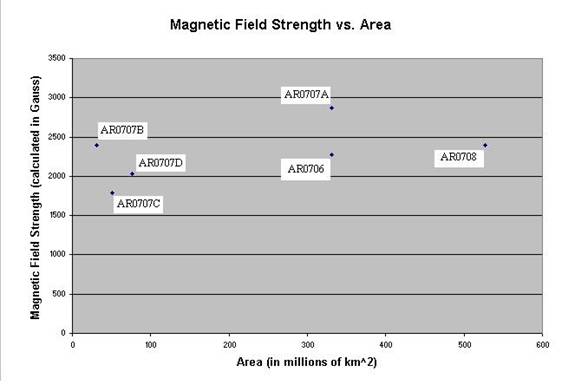
Graph 1- Magnetic Field Strength vs. Sunspot Area
In order to find the latitude and longitude of the sunspots we again used an image from the Big Bear Solar Observatory (http://www.bbso.njit.edu/). From the Big Bear Solar Observatory’s daily files, we observe an image of the Sun that included latitude and longitude grids. We found the latitudes and longitude of the active regions according to that image (see Table 3).
|
Sunspot Location (In arc seconds) |
||
|
|
Latitude |
Longitude |
|
Active Region 0706 |
-116 to -25 |
330 to 460 |
|
Active Region 0707A |
-290 to –250 |
550 to 590 |
|
Active Region 0707B |
-230 to -215 |
570 to 590 |
|
Active Region 0707C |
-250 to -230 |
540 to 555 |
|
Active Region 0707D |
-320 to -290 |
560 to 580 |
|
Active Region 0708 |
-100 to 85 |
60 to 140 |
Table 3- The Sunspot Location of Active Regions 0706, 0707, and 0708
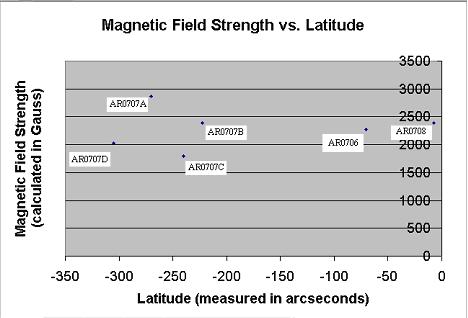
Graph 2- Magnetic Field Strength vs. Latitude (using average latitude
and average magnetic field strength for each sunspot)
Discussion-After reducing and analyzing the data we collected, we
found that we could not definitely prove or disprove our hypothesis with
undeniable certainty. The group of active sunspot regions that we collected and
analyzed data for were moderately similar in size, latitude, and magnetic field
strength; therefore, we were unable to determine if our hypothesis was correct
or not. Upon comparing the latitude measurements and the magnetic field
measurements, we found no negative or positive correlation between the
two. The active sunspot regions with
lesser areas did have somewhat lesser magnetic field strengths compared to the
active sunspot regions with greater areas. However, the data that we analyzed
was much too similar to make any conclusive decision on whether or not we could
prove our hypothesis. More data from a larger range of areas and latitudes
would have to be studied in order to undoubtedly prove or disprove our hypothesis.
Summary and
acknowledgements-Conducting this
research at
References
National Optical Astronomy Observatory [Online] Available at www.noao.edu January 12, 2005.
“Sunspots: Introduction” [Online] Available at http://www.exploratorium.edu/sunspots/index.html
January 13, 2005
Big Bear Solar Observatory [Online] Available at http://www.bbso.njit.edu/ February 14, 2005
“Zeeman Effect” from The Encyclopedia of Astrobiology, Astronomy, and Spaceflight [Online] Available at http://www.daviddarling.info/encyclopedia/Z/Zeemaneffect.html January 13, 2005